Plotting
Expressions defining functions in one variable can be plotted:
![]()
The syntax {x,0,1} defines a list (similar to an array in Julia).
Lists can contain anything, and can be arbitrarily nested
![]()
![]()
We will see later how to access and manipulate lists. For now we will just use simple lists to define the axes.
More plotting
The plotting and visualization functionality of Mathematica is very advanced
You can read the built-in documentation to learn more
Some examples:
![]()
![]()
Interactivity
One of Mathematica’s most powerful features is its interactivity
Consider plotting a set of parabolas
![]()
parameterized by the value a
We begin by choosing a “representative” set
![]()
![]()
Plotting these functions gives us some insight
![]()
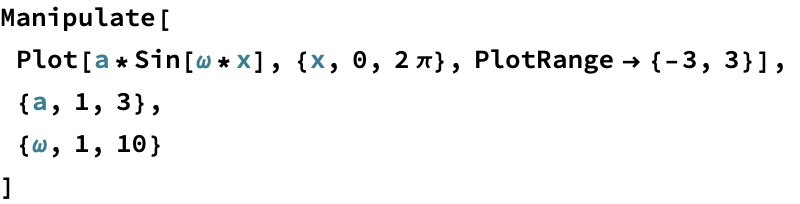
More useful is manipulating the parameter interactively
![]()
We can use manipulate to understand e.g. frequency and amplitude of waves